Google’s own documentation says an AI Overview occupies a single position in Search results. On the query I’ve been tracking, the result Google reports as third sits roughly 1,640 pixels below the top of the page — about 1.7 screens. One position, one full screen of distance. That gap is where the measurement problem starts.
1. What Search Console counts as an AI Overview impression
Search Console has a Generative AI performance report. It became available to a subset of sites in June 2026 and to every site worldwide on 31 August 2026. It reports one metric: impressions.
I’ve written before about what that report does and doesn’t measure, so I’ll keep this short and only cover what changed my reading of the data. Google’s own documentation says the report “includes data from the Web search type in the Performance report” — the AI figures are a slice of the numbers you already see, not a parallel set you add on top.
The clicks are in the same slice. Google states that “clicking a link to an external page in the AI Overview counts as a click.” That means an AI Overview click and a blue-link click are indistinguishable in the export. If you want to know how much of your traffic arrived through an answer box rather than a result, the data will not separate them for you.
The third piece is the one I only understood this month. The same page of documentation defines position for AI Overviews like this:
“An AI Overview occupies a single position in search results, and all links in the AI Overview are assigned that same position.”
Read that twice. An entire AI Overview — a block that on a desktop viewport runs from just under the search bar to below the fold — counts as one position. Every link inside it shares that one number, whether it’s the primary citation or a secondary reference buried behind an expand arrow.
And the counting rule for the report itself means the blind spot runs the other way too. The report counts an impression when your link appears in an Overview. When an Overview appears and cites somebody else, your count for that event is zero — even though the Overview is still sitting on top of your organic result, and still pushing it down the page.
So the report is precise about one half of the problem and silent about the other. It tells you when you were cited. It cannot tell you when you were displaced.
2. Six months, 2,728 AI impressions
The site in question is a small B2B PVC film manufacturer. Over the six months to 1 November 2026 it recorded 110 clicks and 19,040 impressions — a click-through rate of about 0.58%. Over the same window the Generative AI report recorded 2,728 impressions, or roughly 14% of everything Google showed.
That number needs a before, because the shape of the curve explains why I went back to this.
In May and June the report was flat at zero. From 2026-08-30 it steps up and never comes back down: 221 impressions in that week, then 241, then a plateau between 130 and 310, ending at 350 in the last full week of October. Splitting the window at that step:
Window
weeks
impressions
AI impressions
AI share
clicks
CTR
Before 30 Aug
14
6,114
370
6.1%
35
0.572%
After 30 Aug
9
12,516
2,333
18.6%
73
0.583%
The share of impressions coming from generative AI features roughly tripled. The click-through rate moved by 0.011 of a percentage point.
I want to be careful about what that comparison is worth. Total impressions also roughly doubled across the same split, the site’s average position improved, and AI features rolled out to everybody worldwide at the end of August — so the “before” and “after” differ in at least four ways at once. This is a description of what the two halves look like, not an estimate of what the AI features did. Anyone who reads it as the latter is reading a number I did not measure.
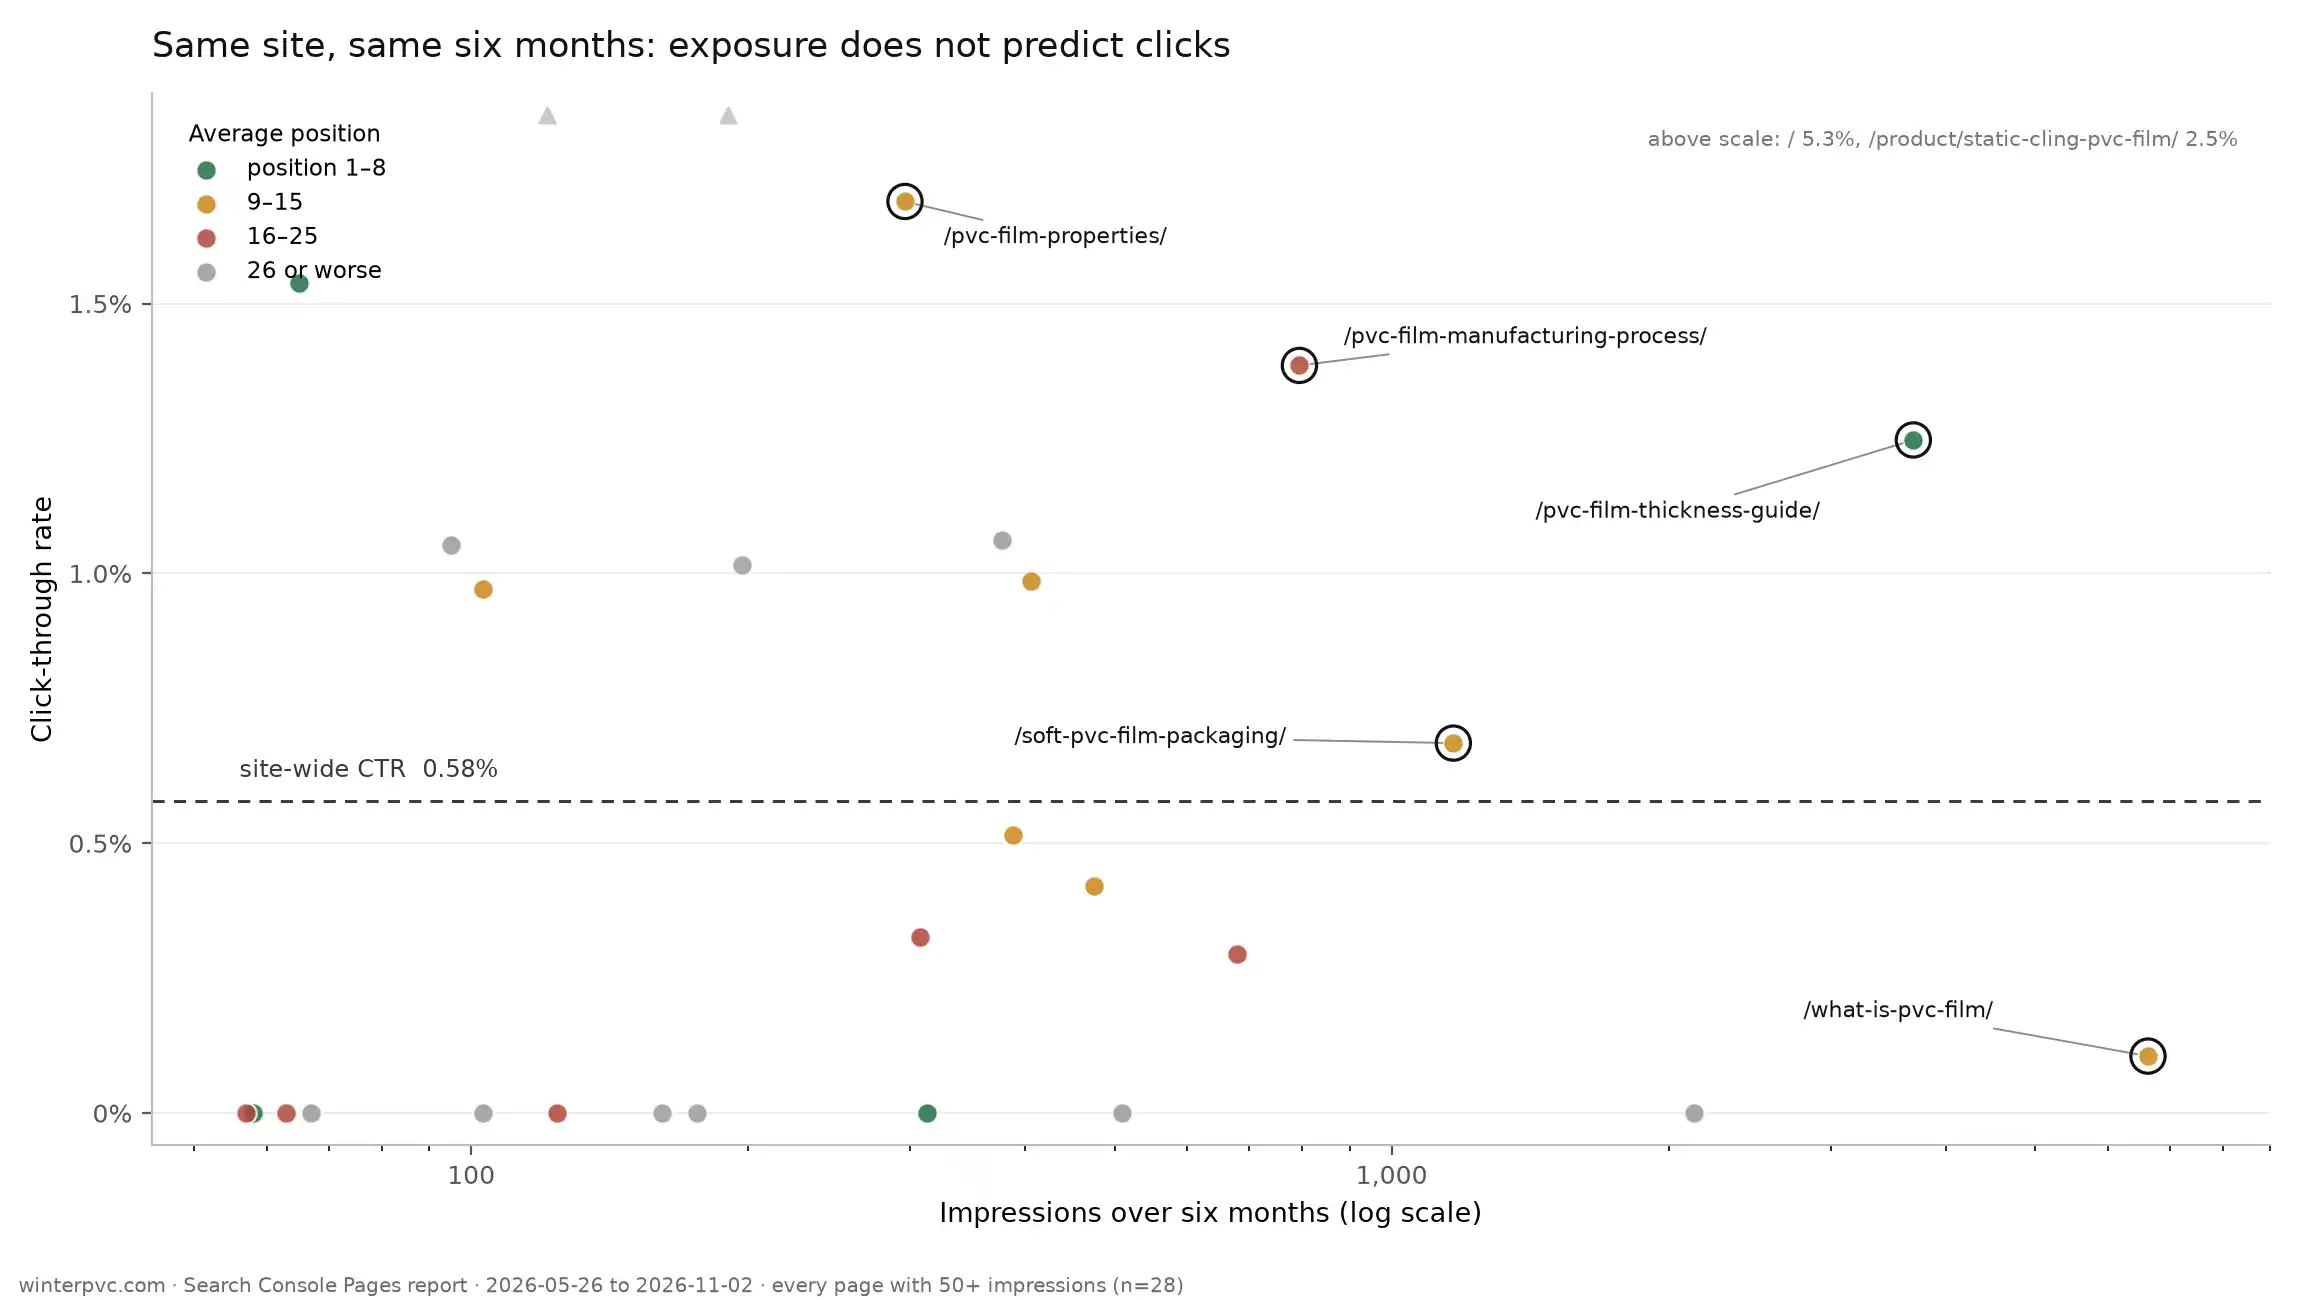
The distribution across pages is lopsided in a way that matters for section 4. Two pages account for 1,816 of the 2,728 AI impressions: the PVC film thickness guide (992) and the “what is PVC film” page (824). Everything else is under 150.
Each dot is a page. Two pages carry 67% of the site’s AI Overview impressions, and their click rates differ by a factor of eleven. The exclusion rule behind this chart is in section 7.Each dot is a page. Two pages carry 67% of the site’s AI Overview impressions, and their click rates differ by a factor of eleven. The exclusion rule behind this chart is in section 7.
3. What an AI Overview position looks like on a real page
Numbers about position are abstract until you look at the page they describe. So I searched the same query — `what is pvc film` — from three sessions on three consecutive days, 3, 5 and 6 November 2026, in a private window, not signed in, with the location showing California.
The result was identical three times.
An AI Overview appears at the top and occupies the whole first screen. Its source cards name Achilles USA, Grafix Plastics and Amazon. My page is not among them.
My page is the third organic result. Before a reader reaches it, the page delivers: the AI Overview, the first organic result, four “People also ask” questions, a three-item video block, the second organic result, and — in one of the three sessions — a shopping block. Between five and six blocks sit above a result that Google counts as third.
On a 991-pixel viewport, the title of my result lands roughly 1,640 pixels below the top of the page. That is about 1.65 screens of scrolling.
For contrast, the same query from a session showing Tokyo: the AI Overview appears, its first source card is my page, my result is the first organic listing, and the title sits about 660 pixels down. The Overview is in both cases. Whether it names me is the difference between being 0.7 screens away and being 1.65 screens away.
Three caveats, and they are not decorative.
First, three sessions on one query is not a trend. I wrote in September that two data points are an anecdote and that I would rather publish an anecdote labelled as one — this is three, on one query, in one week, and I am labelling it as a description of a layout that happened to repeat.
Second, only the 5 November session carries location evidence I’d call firm: the page footer says the location was inferred from the IP address. The 6 November session says it was inferred from activity history. Both showed California; only one is IP-based.
Third, the browser interface in all of these captures was in Chinese. The AI Overview and every result on the page were in English, and I have no evidence that interface language changes which results are served, but I cannot rule it out either. I’d rather say that than have someone find it later.
What the captures do establish is narrower and more useful: the position number and the distance are different quantities. Google counted the Overview as one position and reported my page as third. On the page itself, third was nearly two screens down.
4. Why my September explanation isn’t enough
On 10 September I published the page-level numbers for the “what is PVC film” page over a three-month window, June to early September: 4 clicks, 3,075 impressions, a CTR of about 0.13%, and an average position of 20.9.
I explained the missing clicks as intent. That page exists to answer a question, someone who wants an answer can often get it without clicking, and clicks on research-stage pages lag — sometimes they never arrive, because the intent behind “what is PVC film” is generic. I still think that is part of the answer.
Three more months of data say it is not the whole answer.
Over the full six months the same page recorded 6,633 impressions and 7 clicks — 0.11%. In the September window that was one click per 769 impressions. Now it is one click per 948. The rate did not recover; it got marginally worse.
That matters for how I read my own earlier post. “Clicks lag” implies a lag — a delay after which the clicks show up. Two more months is a reasonable test of that, and they did not show up. What did show up in the meantime is the thing in section 3: the page got cited by AI Overviews 824 times, and on the query I can actually look at, the Overview cites three companies that aren’t me and puts my result 1,640 pixels down.
So there are now two candidate explanations where a year ago I’d have offered one:
1. Intent. People searching a definitional question often leave satisfied. This is real and I have no way to rule it out.
2. Displacement. The Overview occupies the space the click used to come from, and the position metric compresses that space into a single digit.
I cannot separate them with the data I have. What I can say is that September only contained the first explanation, and the second one is at least as consistent with six months of flat clicks — and unlike the first, it comes with a rule in Google’s own documentation.
That reframing is the useful part. It moved the question from “why don’t people click my definition page” — which has no testable answer — to “how far down does the Overview push me, and does that distance predict the click rate” — which does.
5. Three of September’s six questions now have answers
In September I closed with six things I intended to track. Answering them is the cleanest way to show what three more months actually bought.
1. Would AI impressions keep growing? Yes — but the two numbers don’t measure the same thing and I should say that before I compare them. September’s figure was 22, for one page over three weeks. The current figure is 2,728, for the whole property over six months. The shape is what matters: zero through June, a step at the end of August, and no return to zero since.
2. Would more pages appear in the report? Yes. One page then; 35 URLs now. Two of them — the thickness guide and the definition page — account for two thirds of the total, so “more pages” mostly means “a long tail of small numbers.”
3. Would traditional clicks rise as impressions rose? In absolute terms, yes: 35 clicks in the earlier half of the window, 73 in the later half. But impressions nearly doubled across the same split, so the rate did not move — 0.572% to 0.583%. This is the question I asked most naively, because it has no denominator attached.
4. Would the queries behind those clicks move closer to purchase intent? I cannot answer this, and I now think I never will from this source. Of the 110 clicks in the window, 7 appear in the query report. Google withholds low-volume queries for privacy reasons, and the long tail is exactly where purchase intent lives. This is a permanent blind spot, not a data gap I can wait out.
5. Did any of this change after further page edits? Cannot answer. I edited pages without recording the dates against page-level exports, so there is no baseline to compare against. That is the same mistake I described in September, made again.
6. Does the thickness guide’s lead hold? It holds, and it is narrowing. At the September checkpoint the thickness guide had roughly ten times the AI impressions of the packaging page. Now it is 992 against 114 — about 8.7 times. The packaging page is growing faster (5.2 times over the same period, against 4.2 times for the thickness guide).
That last number is worth sitting with, because it is the only one that touches the two hypotheses I published in September: content shape, and start date. A narrowing gap is what you would expect if the gap was partly a head start. It is also what you would expect from a dozen other things. Two pages is still not a sample, and I am not going to pretend otherwise.
6. The industry numbers are conditional too
The claim I keep running into is that AI Overviews reduce clicks by 30 to 60 percent. I went looking for the study that says it, and as far as I can tell there isn’t one.
What exists is narrower. Ahrefs estimated a 34.5% CTR reduction for position-one results on informational queries with an AI Overview, in April 2025, and re-ran the same method ten months later in February 2026 and got 58%. The two ends of that range come from the same lab, ten months apart, using the same counterfactual approach.
Both are conditional numbers. They describe the click rate of a result given that an Overview appeared above it. That is a different quantity from the effect on a site, or on search overall.
The only randomised trial I found makes the difference explicit. Agarwal and Sen ran 68,089 searches with 1,065 participants and found that when an AI Overview appeared, outbound organic clicks fell 39.8%. Because only about 41% of searches in their sample triggered an Overview, the effect across all searches works out to roughly 18.5%.
Seer Interactive’s panel points the other way on one specific point. Their data has cited pages doing better than uncited ones — 0.70% CTR against 0.52% — while both fall far below pages with no Overview at all. Their 2026 update puts cited pages 120% ahead of uncited, and still 38% below no-Overview.
That matters for this post, because it is the opposite of what my own numbers show. At page level I could not detect any relationship between being cited and click rate. The honest reading is not that Seer is wrong. It is that 110 clicks cannot detect a difference of that size, and my aggregate is too blunt to try.
What both literatures share is a conditional frame. The industry studies condition on an Overview appearing. The Search Console report conditions on you being cited. Each reports a slice as if it were the whole, and the whole — how much clicking exists on that results page at all, and who gets it — is the part nobody can see from inside a rank tracker.
7. What I measured and did not use
I ran four comparisons across the 28 pages with enough impressions to say anything: AI citation rate against CTR, citation rate against average position, average position against CTR, and the same pairings by week.
I am not printing the coefficients, for two reasons that I think hold up.
First, the assumption behind a significance test here is wrong. Search Console impressions are not independent trials — the same pages are shown for the same queries to the same people, repeatedly, over six months. A p-value computed on 6,633 impressions would be decoration.
Second, and more important: the variable I would want to test is not independent of the outcome I care about. Pages that rank better get cited more, and pages that rank better get clicked more. Any coefficient between citation rate and CTR is mostly a coefficient about ranking, wearing a different label.
There is a third problem hiding inside the second. When I compared average position to CTR at page level, the relationship was not distinguishable from zero — which is not a finding about click-through rates. It is a finding about average position: a page that ranks third for some queries and fortieth for others has a number in the middle that describes neither.
I also made one exclusion I should state rather than bury. The product index page carried 2,131 impressions — roughly a ninth of the site — at an average position of 49, with zero clicks. Leaving it in drags the site-wide CTR down for reasons that have nothing to do with AI. I excluded pages averaging worse than position 25 from the click-rate comparisons. I did that after seeing that the page had no clicks, which is why I am telling you rather than quietly applying it.
8. What this still cannot tell you
The blind spot is structural, not statistical. Search Console records an AI impression when my link appears in an Overview. When an Overview appears and cites three competitors, my record for that event is zero. The single most expensive thing an Overview can do to a small site — occupy the space where its click used to be, without naming it — is the thing the report is designed not to see.
I also have no power to detect small effects. 110 clicks over six months cannot distinguish a 30% change in click rate from noise. If the true effect on a site like mine were 10%, this dataset would look exactly as it does now.
And I have one genuine anomaly I cannot explain. The China segment of the data shows 1,606 impressions at an average position of 6.4 with a single click — a 0.06% click rate, against a next-lowest country figure of 0.62% and most others between 1% and 2.4%. Nothing about that pattern looks like a person reading a results page. I cannot prove it isn’t, so it stays in the post as an open question rather than an explanation.
What I can say is narrow. On this site, over six months, AI features accounted for about 14% of impressions, the click rate did not move when that share tripled, and the one result I could look at on an actual page sat roughly 1,640 pixels down while Google reported it as third.
That is a description of one small site. It is not evidence about AI search in general, and it is not an estimate of what AI Overviews “do” to clicks.
What I want to test next is the part that would change my mind either way. If citations are mostly a by-product of ranking, then adding quotable sections to a page should not move the citation count on its own — the ranking has to move first. If citations have their own logic, the count should rise while the position holds.
The thickness guide is at 992 AI impressions and the definition page is at 824. When either passes 2,000, I will write the next one of these with a real before-and-after instead of a description.
Quick Context: I spent the last few months assuming my AI visibility problem was a content problem — that my pages were too thin, too new, or too boring to be quoted. Then I pulled eight days of raw server logs for this blog. GPTBot requested my site 14 times and got a rate-limit error…
Quick Context: I have been measuring AI search visibility for a few months, first badly and then slightly less badly. The first version of this post was the bad version: it treated “AI visibility” as one number, borrowed a screenshot from a tool, and called the numbers traffic. This version separates four metrics that get…
Quick Context: This is the first part of a three-part tracking note, published on my personal blog, BenchJournal. When I started, I thought I already knew how to measure SEO: open Search Console, screenshot the graph, feel good about it. Then I ran three very different page types — an informational blog post, a product…
Quick Context: I run a small B2B PVC film export site, and last time I wrote about testing Surfer SEO on one of my product pages. This isn’t a strict experiment — just an early, honest look at how the same page performs across two very different search surfaces: traditional Google Search and Google’s newer…