What 22 Google AI Search Impressions Mean for a Small B2B Page
Quick Context: I run a small B2B PVC film export site, and last time I wrote about testing Surfer SEO on one of my product pages. This isn’t a strict experiment — just an early, honest look at how the same page performs across two very different search surfaces: traditional Google Search and Google’s newer generative AI search visibility features. This post now includes where the number comes from, what the timeline actually looks like, and how to pull the same report for your own site.
Test Conditions
Everything below is one page, two reports, two windows. Here is the exact setup so you can repeat it or challenge it:
| Item | Value |
|---|---|
| Page under test | winterpvc.com/soft-pvc-film-packaging/ |
| Page title | Soft PVC Film for Packaging Applications: Specifications, Grades, and Supplier Guide |
| Page type | Product-support guide page (specification + supplier guide), ~2,500 words with 3 specification tables and a 14-question FAQ section |
| Optimized with | Surfer SEO — the same page covered in my Surfer SEO review |
| Regular Search window | 2026-06-02 → 2026-08-31 (3 months) |
| Generative AI window | 2026-06-02 → 2026-09-01 (3 months) |
| Site age at capture | Roughly 3 months live |
| Metrics observed | Clicks, impressions, CTR, average position, query-level impressions, Generative AI impressions and their daily distribution |
The Page I’m Tracking
This article looks at a page I optimized with Surfer SEO — the same “Soft PVC Film Packaging” page I covered in my Surfer SEO review. It’s aimed at anyone curious about how a small B2B page shows up differently in regular search results versus Google’s AI-generated search features. Structurally it is a fairly typical B2B buyer guide: a table comparing six film grades, a thickness selection table by packaging type, a PVC vs. PET/PP/PE material comparison, and a FAQ block written as direct questions.
Raw Data
Traditional Search Performance
Here’s how this article performs in Google Search Console (note: my GSC interface is set to Chinese, but the underlying numbers apply regardless of language): 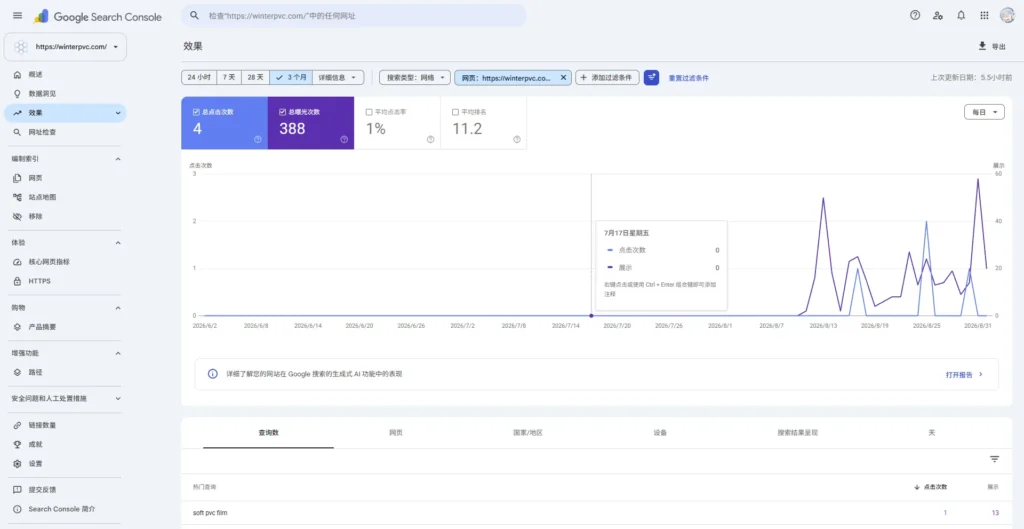
- Impressions: 388
- Clicks: 4
- CTR: about 1%
- Average position: 11.2
- Top query: “soft pvc film” — 1 click from 13 impressions
I honestly don’t know yet whether this counts as “good” or “bad” for a website that’s only been live for three months. It’s early days, and I’m treating this as a baseline rather than a verdict. One detail I want to keep in the record: the single top query accounts for 13 of 388 impressions, so the page is not riding on one term — the rest of its visibility is spread thin across many low-volume queries.
Generative AI Search Performance
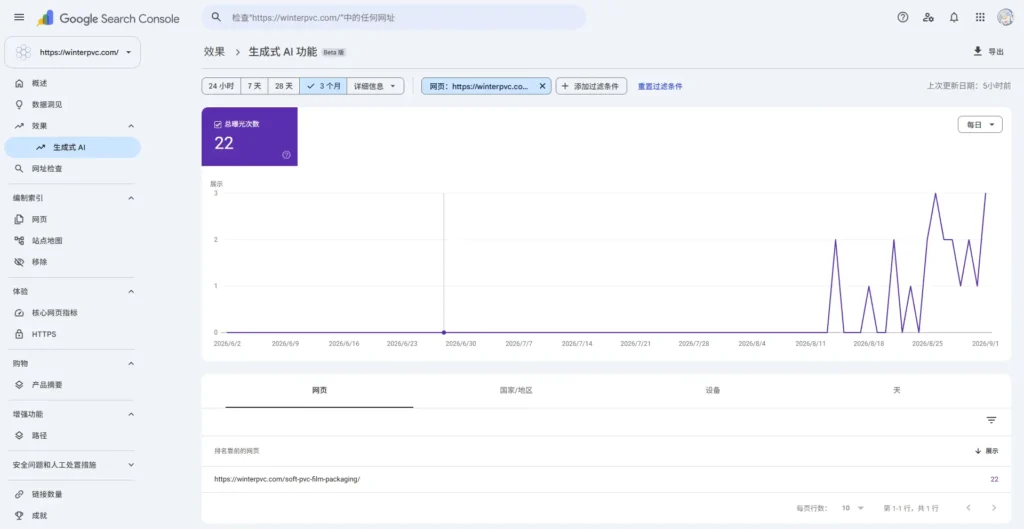
Separately, Google Search Console also has a “Generative AI” performance report — and this same page shows 22 impressions there over the past 3 months. But that’s not 22 clicks, and it’s not 22 visits. It’s just 22 times the URL appeared as a source inside Google’s AI-generated search features.
One thing worth noting: unlike the regular Search performance report, this Generative AI report currently doesn’t show which specific queries triggered those impressions. So I can see that the page showed up, but not why or for what search term.
| Metric | Result | Source |
|---|---|---|
| Impressions | 388 | Regular Search report |
| Clicks | 4 | Regular Search report |
| CTR | ~1% | Regular Search report |
| Average position | 11.2 | Regular Search report |
| Generative AI impressions | 22 | Generative AI report |
These numbers come from two different Search Console reports and shouldn’t be treated as directly comparable — they measure different things.
The time distribution of those 22 impressions
A total of 22 over three months sounds like a slow trickle. The daily curve says something different, and this is the part I would have missed if I had only written down the total:
| Period | Generative AI impressions | What it looks like on the chart |
|---|---|---|
| 2026-06-02 → 2026-08-10 | 0 | A perfectly flat line on the floor, for ten weeks. |
| 2026-08-12 (first non-zero day) | 1 | The first spike, appearing about three weeks before the screenshot. |
| 2026-08-12 → 2026-08-20 | Isolated spikes of 1–2, separated by days of 0 | Spiky, intermittent. The page was being cited occasionally, not consistently. |
| 2026-08-21 → 2026-09-01 | Climbing toward 2–3 per day, with fewer zero days | The curve stops touching the floor and starts trending upward. |
So the honest reading of “22 impressions over three months” is: zero for the first ten weeks, then 22 in the final three. For a new site, that is a much more interesting shape than a flat trickle, and it is a reason not to write off a small total as noise. It is also a reason to be careful: three weeks of data is not a trend, it is the beginning of one.
What Changed
Stripped down to what the two reports actually show, the movements are these:
| Signal | Value | Evidence |
|---|---|---|
| Generative AI impressions went from zero to a steady trickle | 0 → 22 | Daily curve: flat on the floor until 2026-08-11, then rising |
| The page was confirmed as an AI-cited source | 1 URL listed | The Pages tab in the Generative AI report lists /soft-pvc-film-packaging/ with all 22 |
| Traditional search visibility exists independently of the AI report | 388 impressions / 4 clicks | Regular Search report, separate measurement |
The first row is the only one I would call a genuine change, and even that is really “the line started moving” rather than “the line went up.” The second row is not growth at all — it is a fact I did not previously have: I now know this URL is being used as an AI source, which is different from knowing that people find it.
What Did NOT Change
This list is short but it is the part that keeps me from over-reading the number 22:
| Thing that did not move | Status | Why it matters |
|---|---|---|
| Clicks | 4 clicks over the whole window | The AI impressions have produced no measurable click growth on the traditional side either. |
| Average position | 11.2 — still page two | The page has not reached page one, so the click ceiling is unchanged. |
| AI impressions before 2026-08-11 | 0, for ten straight weeks | Most of the three-month window contains no AI visibility at all. A 3-month average would hide this. |
| Queries behind the AI impressions | Not available | I can see that the page was cited, never for what question. |
| Business outcomes | Not measurable | Neither report connects an AI impression to an inquiry, a sample request or a quote. |
What I Can and Cannot Conclude
What I can confirm:
- My page has been indexed by traditional Google Search
- The same page has also appeared in Google’s generative AI search features
- Traditional search visibility (388 impressions) is currently much higher than generative AI visibility (22 impressions)
- All 22 AI impressions were recorded after 2026-08-11, not spread across the whole three-month window
What I cannot confirm yet:
- Whether Surfer SEO’s optimization directly caused either result
- Which exact queries triggered those 22 AI impressions — the Generative AI report doesn’t show query-level data
- Whether generative AI visibility translates into real business value (an inquiry, a click, anything measurable)
- Whether this AI visibility will hold steady, grow, or disappear over time
Why This Page, and Not the Others?
This is the question that actually made the data useful. If one page starts getting cited by AI answers, the natural next question is whether other pages are getting cited too — or whether something about this page specifically earned it.
| Page | Generative AI impressions | Curve shape |
|---|---|---|
| /pvc-film-thickness-guide/ | 209 → 238 (measured 2026-08-31 and 2026-09-08) | Started lifting off zero in mid-July, then oscillated upward |
| /soft-pvc-film-packaging/ (this page) | 22 | Flat zero until 2026-08-11, then a three-week climb |
Two pages on the same site, in the same period, differ by roughly ten times. I do not have enough data to prove why, but there are two differences worth watching, and I have written both down as hypotheses rather than findings:
- Topic shape. The thickness guide is built around definitional, numeric questions (“what thickness for X application”, “what tolerance”). That format maps almost directly onto the phrasing of AI-generated answers. The packaging page is closer to commercial evaluation content — grades, supplier checklists, quotation preparation.
- Start date. The thickness guide began collecting AI impressions in mid-July; this page began in mid-August. The ten-fold gap may partly be a one-month head start rather than a content difference at all.
I am deliberately not concluding “structured data gets you cited.” With two pages and three weeks of data, that would be a story, not a result.
How to Check This Yourself
Everything in this post is visible to anyone with a verified Search Console property. The Generative AI report is currently labelled Beta, so the exact wording may change, but as of 2026-09 the path is:
- Open Google Search Console and select the correct property (in my case
https://winterpvc.com/). - In the left sidebar, open Performance / 效果.
- Under Performance, choose Generative AI / 生成式 AI (Beta). This is a separate report from the normal Search performance view — the impressions are counted differently, which is exactly why the two totals must never be added together.
- Set the date range using the 3 months preset, or a custom range. Note the length of the range, because a total without a window is meaningless.
- Click + Add filter / 添加过滤条件 → Page / 网页, then enter the page’s path (for example,
/soft-pvc-film-packaging/). This isolates one URL so you are not reading site-wide noise. - Read Total impressions / 总曝光次数 at the top, then switch the graph to Daily / 每日 and look at the shape of the curve — specifically, find the first day the line leaves zero.
- Scroll to the table below the graph and open the Pages / 网页 tab to confirm which URL earned the impressions.
- Check the last update timestamp in the top-right corner. Search Console data lags, and the two reports do not always refresh at the same hour — my two screenshots were taken minutes apart and showed “updated 6 hours ago” and “updated 5.5 hours ago”.
- Note what you cannot get: query-level data for Generative AI impressions, and any click, inquiry, or revenue attribution. If you need the “why”, you have to infer it from the page’s structure and topic.
What I’ll Track Next
Going forward, I’ll keep an eye on:
- Whether generative AI impressions continue to grow
- Whether more pages start appearing in the AI report
- Whether traditional search clicks increase as impressions grow
- Whether the queries behind those clicks move closer to real B2B purchase intent
- Whether any of this changes after further page updates
- Whether the /pvc-film-thickness-guide/ lead holds, or whether this page closes the gap
Data Reproducibility Note
Both screenshots in this post were captured on 2026-09-04 from a verified Google Search Console property. The Regular Search figures cover 2026-06-02 → 2026-08-31 and the Generative AI figures cover 2026-06-02 → 2026-09-01; the two windows are one day apart, so the totals are as comparable as these two reports allow. The page itself was last optimized before this window opened, so nothing in these numbers reflects a change made during the measurement period. I will re-pull both reports with identical window lengths at the next checkpoint and publish the comparison whether it supports the pattern or breaks it.
Conclusion
Right now, the honest takeaway is small: this page is visible in both traditional search and Google’s AI search features, but the AI-side data is too limited to draw any real conclusions from yet. What changed my reading of it was the timeline — ten weeks of zero followed by three weeks of steady citation looks less like a rounding error and more like the beginning of something. I’ll keep tracking both reports and share what actually changes — not what I expect to happen.
These metrics come from two different Search Console reports. The regular Search performance report and the Generative AI performance report should not be treated as directly equivalent.
Want to see how this evolves? Enter your email the left input field. and I’ll share the update as soon as there’s meaningful data
Frequently Asked Questions
A few questions I keep getting about this experiment, answered directly:
Where in Google Search Console do I see generative AI impressions?
In a verified property, open Performance and then choose Generative AI (Beta) in the left sidebar. It is a separate report from the normal Search performance view and the impressions are counted differently, so the two totals should never be added together.
Are those 22 AI impressions clicks or visits?
Neither. It is 22 times the URL appeared as a source inside Google’s AI-generated search features. The Generative AI report exposes no click data, so nothing in it can be attributed to a visitor, an inquiry or a lead.
Which queries triggered the AI impressions?
That data is not available. Unlike the regular Search performance report, the Generative AI report does not show query-level data, so I can see that the page was cited but not for what question.
Were the 22 impressions spread across the whole three months?
No. The page recorded zero generative AI impressions from 2026-06-02 to 2026-08-10, and all 22 came in the final three weeks, starting around 2026-08-12. A three-month average would hide that.
Why does one page get cited roughly ten times more than another?
I do not have enough data to prove it. Two differences are worth watching: the thickness guide is built around definitional, numeric questions that map closely onto AI answer phrasing, while the packaging page is closer to commercial evaluation content, and the thickness guide started collecting AI impressions about a month earlier.