9 Days After Optimizing With Surfer SEO: What Actually Changed on My B2B Page
Quick Context: This is a follow-up to my Surfer SEO review, where I optimized a page on my B2B PVC export site. It’s been 9 days since that optimization went live. Here’s what actually changed, in a form you can check — the conditions, the raw numbers, the things that stayed flat, and what I’m testing next.
Test Conditions
Before the numbers, here is exactly what was measured and when. I am writing this section because the last post left people asking “compared to what?” and the honest answer is: compared to a fixed baseline, on a fixed URL, over two windows that are close in length but not identical.
| Item | Value |
|---|---|
| Page under test | winterpvc.com/pvc-film-thickness-guide/ |
| Page type | Product-support guide page on a B2B PVC film export site |
| Optimization went live | 2026-08-31 |
| Measurement window 1 (baseline) | 2026-05-29 → 2026-08-28 (Regular Search) and 2026-06-06 → 2026-08-31 (Generative AI) |
| Measurement window 2 (checkpoint) | 2026-06-06 → 2026-09-05 (both reports) |
| Elapsed time since optimization | 9 days (2026-08-31 → 2026-09-08/09) |
| Metrics observed | Surfer Content Score (SEO + AI Search), GSC clicks, impressions, CTR, average position, Generative AI impressions |
| What was NOT changed between the two measurements | URL, page template, internal linking, and — as the data below shows — the word count |
Raw Data
Search performance, checkpoint to checkpoint
Here is the checkpoint-to-checkpoint record. The regular Search and Generative AI figures come from two different Search Console reports and are never directly comparable, so I have kept them separated instead of summing them into one “traffic” column.
| Metric | Aug 31 | Sep 8 (9 days later) |
|---|---|---|
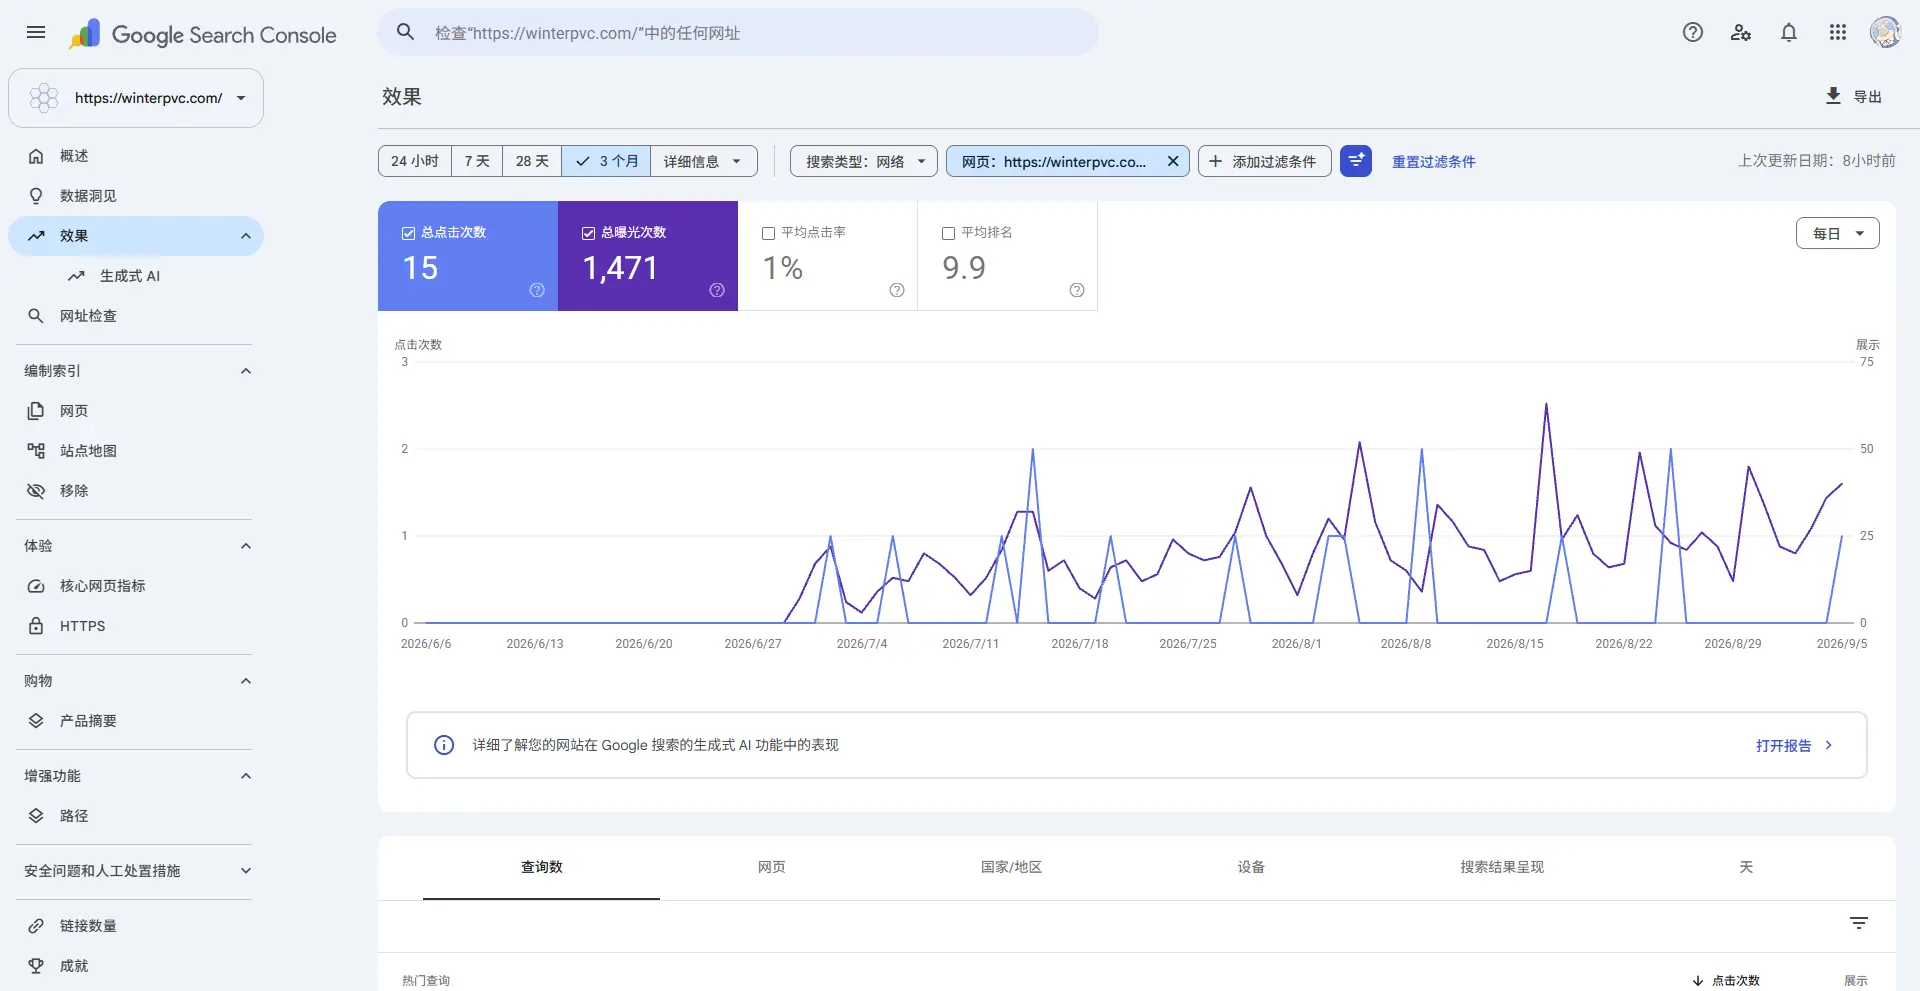
| Total Clicks | 14 | 15 |
| Total Impressions | 1,235 | 1,471 |
| Average CTR | 1.1% | 1% |
| Average Position | 10.1 | 9.9 |
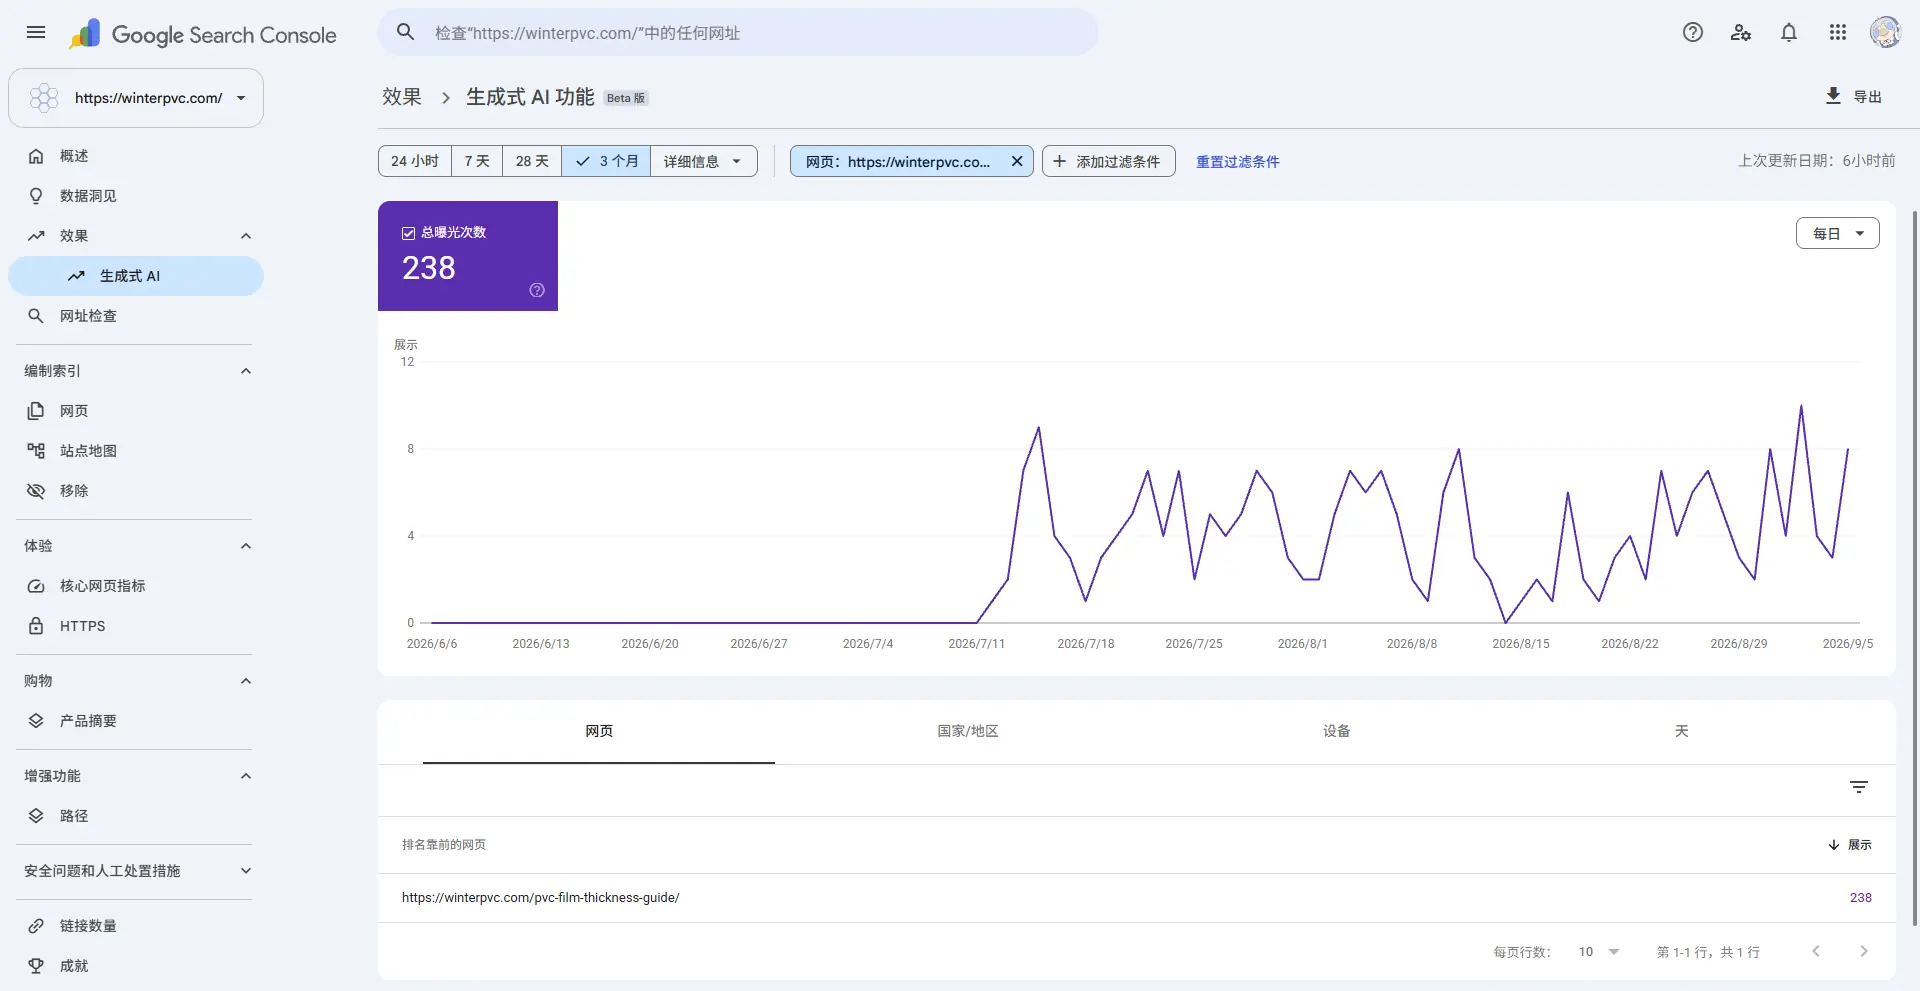
| Generative AI Impressions | 209 | 238 |
This is the Regular Search checkpoint the table above is built from — 15 clicks, 1,471 impressions, 1% CTR, average position 9.9, over the 2026-06-06 → 2026-09-05 window:
The Generative AI curve, including the zero weeks
And this is the Generative AI report for the same page, also on Sep 8 — 238 AI impressions. The shape of this curve matters more than the total, and I explain why below:
Two rows from the Generative AI curve that a totals-only table would hide, and that I am keeping in the record precisely because they are zero:
| Period | Generative AI impressions | Note |
|---|---|---|
| 2026-06-06 → 2026-07-08 | 0 | A flat line on the bottom of the chart. The page did not appear in AI-generated results at all during this month. |
| 2026-07-10 (first non-zero day) | 1 → 9 (peak around 2026-07-16) | The line lifts off the floor in mid-July, roughly six weeks before my optimization went live. |
That second row is the uncomfortable one, and it is the reason I am not claiming credit for the AI growth. The AI impressions started moving in mid-July, and my optimization went live on August 31 — so the trend predates my work. What I can say is that the trend continued (+29 impressions, about +14%) rather than reversing. I cannot say the optimization caused it.
What Changed
Being specific about what is confirmable versus what is only possible:
Confirmed changes:
- Impressions: 1,235 → 1,471 (roughly +19%).
- Generative AI impressions: 209 → 238 (roughly +14%).
- Average position: 10.1 → 9.9, a small nudge better.
Possible but not established: whether any of the above was caused by the Surfer optimization. Nine days and fewer than 1,500 impressions is a small sample, the two windows are shifted by about eight days, and the AI trend started before the change went live. Impressions rising while clicks stay flat is also a well-known pattern for informational B2B pages — you get shown more often without getting chosen more often.
What Did NOT Chang
This section exists because leaving it out would make the post misleading. None of the following moved in any meaningful way:
| Metric | Change | Possible reason |
|---|---|---|
| Clicks | 14 → 15 (+1) | Average position is still ~10, the page-one boundary. An extra 236 impressions spread across three months is not enough to produce a visible click signal. |
| CTR | 1.1% → 1% (flat, slightly down) | More impressions at low positions pulls the average CTR down mechanically. It is an arithmetic effect before it is a content effect. |
| Word count | 3,579 → 3,579 | I did not add text in this cycle. The optimization was about how the existing words answer questions, not about producing more of them. |
| SEO sub-score | 46 → 46 → 46 | Unchanged through the first two checkpoints; it only moved at the third (see the score table below). Whatever the SEO component measures takes longer than nine days to shift. |
| Page-one ranking | Still not achieved | Position 9.9 sits on the edge of page one, not inside it. This was the original goal and I have not reached it. |
Not Every Suggestion Deserves the Same Answer
What I found more useful this round wasn’t the score — it was noticing that rejected suggestions aren’t all rejected for the same reason.
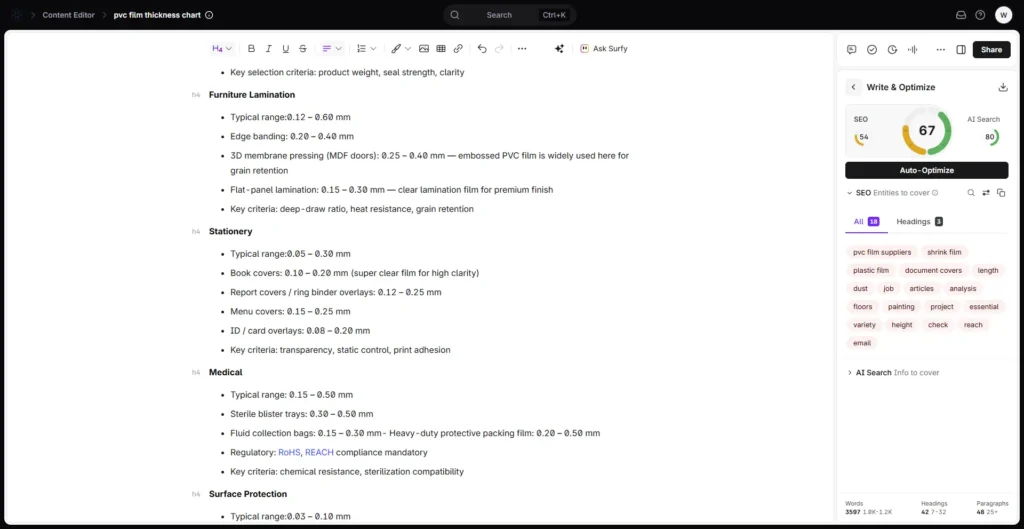
“Shrink film” was the easy one. It’s technically a type of PVC film, so Surfer’s logic wasn’t crazy. But it’s not a product we manufacture. Adding it would’ve been defensible on paper and dishonest in practice — anyone searching around that term isn’t looking for what we sell.
“Plastic film” was trickier. It’s not wrong — PVC film is a type of plastic film. But it’s so broad it wouldn’t add any real information. My article is specifically about PVC gauge charts and tolerance standards. Diluting that with a generic umbrella term felt like it would blur the page’s focus rather than sharpen it.
Not every rejected suggestion is wrong for the same reason. Some are just off-topic. Others are technically correct but too vague to be useful. That’s a different kind of judgment call than simply spotting a factual mismatch — and it’s the part a tool can’t do for you.
The Score
Because I took screenshots at different points, I can show the score as a timeline rather than a single value. This is the most useful table in the post, because it shows that the two components moved at completely different speeds:
| Checkpoint | SEO | AI Search | Total |
|---|---|---|---|
| Before optimization (2026-08-31) | 46 | 57 | 52 |
| Immediately after (2026-08-31) | 46 | 70 | 58 |
| Checkpoint 2 (2026-09-06) | 46 | 75 | 61 |
| Checkpoint 3 (2026-09-08) | 54 | 80 | 67 |
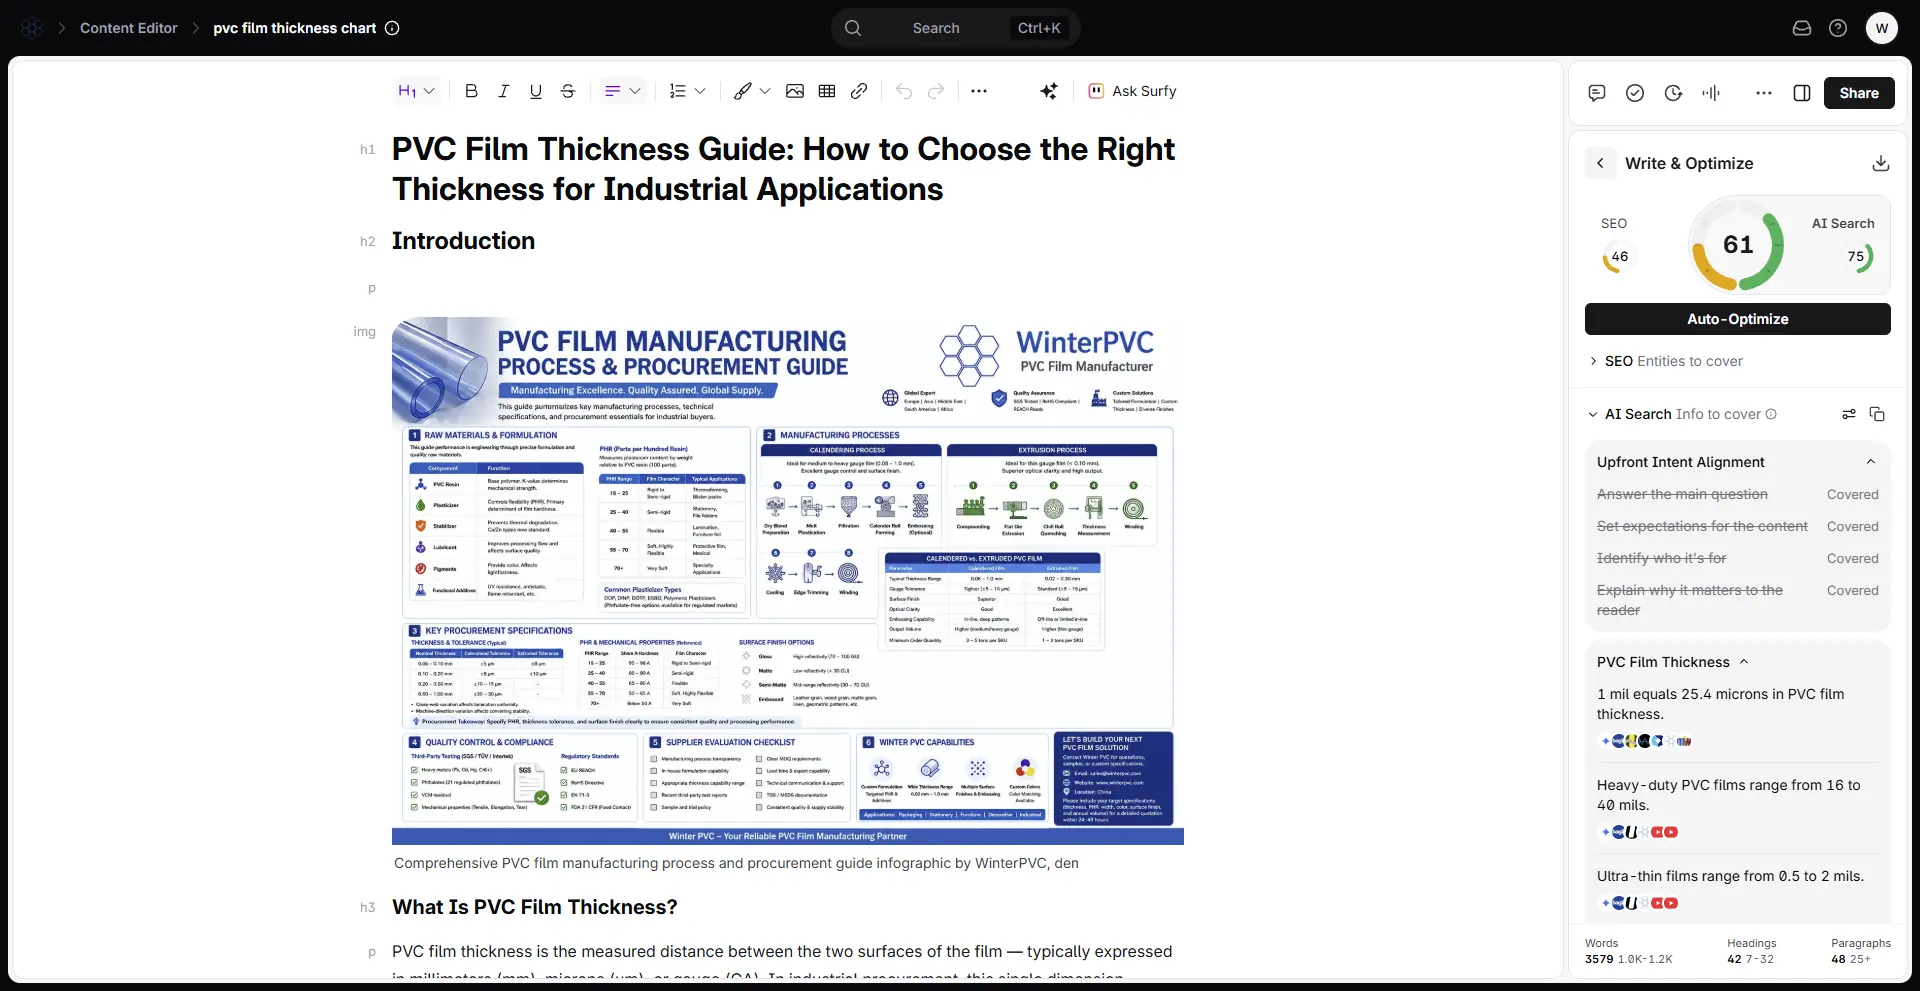
Read the two score columns separately and the story is clear. AI Search climbed 57 → 80 across the four checkpoints. SEO sat at exactly 46 for three of them and only then moved to 54. If I had judged the work by the total score alone, I would have concluded “steady progress, +15 points.” What actually happened is that one half of the score carried almost the entire gain, and the other half was asleep for nine days and then woke up once the entity coverage was completed.
Some of the suggested terms fit naturally. Others — like the two above — were worth noting but not worth using.
What’s Next
I’ll check back again in a few weeks. If clicks and CTR start moving, that’s a more meaningful signal than impressions alone. If they don’t, that’s useful information too. Concretely, here is what I am testing and what would falsify each idea:
| Hypothesis | What I will measure | What would disprove it |
|---|---|---|
| The AI visibility gain is real and sticky, not a mid-July blip that happened to be captured in my window. | Generative AI impressions at the next checkpoint, using an identical three-month window length. | The AI curve flattening back toward its pre-July baseline. |
| The SEO sub-score has now broken out of 46 and will keep moving as entity coverage is finished. | The SEO component at 30 days, together with the “SEO Entities to cover” count. | SEO back at 46 while entity coverage is unchanged. |
| Impressions will convert into clicks only once average position clears the page-one boundary properly. | Average position and CTR together, not separately. | Clicks rising while position stays near 10 — that would mean the CTR problem is the title and description, not the ranking. |
Data Reproducibility Note
All figures in this post come from three captures. Surfer Content Scores were captured on 2026-08-31 (before and after optimization), 2026-09-06 and 2026-09-08. Google Search Console Regular Search data was captured on 2026-08-31 (window 2026-05-29 → 2026-08-28) and 2026-09-08 (window 2026-06-06 → 2026-09-05). Generative AI data was captured on the same two dates (windows 2026-06-06 → 2026-08-31 and 2026-06-06 → 2026-09-05). The optimization went live on 2026-08-31. Two limitations I want on the record: the two windows are shifted by about eight days, so impression totals are only roughly comparable; and the data here is checkpoint-level rather than day-by-day, so daily fluctuation is not visible in these tables.
IF YOU WANT TO KNOW NEXT SURFER SEO REVIEW, PLEASE SUBCRIBE MY WEBSITE
Frequently Asked Questions
A few questions I keep getting about this experiment, answered directly:
Did the Surfer optimization cause the impression growth?
I cannot say that. The Generative AI impressions started lifting off zero in mid-July, roughly six weeks before the optimization went live on 2026-08-31, so the trend predates the change. What I can say is that the trend continued, with 29 more impressions, rather than reversing.
Why did clicks not increase even though impressions did?
Average position is still around 10, which is the page-one boundary, and an extra 236 impressions spread across three months is not enough to produce a visible click signal. More impressions at low positions also pulls the average CTR down mechanically, from 1.1% to 1%.
What did not change in the nine days after optimizing?
Clicks moved from 14 to 15, CTR from 1.1% to 1%, the word count stayed at 3,579, and the SEO sub-score stayed at exactly 46. The page still has not reached page one.
Why were some of Surfer’s suggested keywords rejected?
Because they were rejected for different reasons. “Shrink film” is a type of PVC film but not a product we manufacture, and “plastic film” is technically correct but too broad for a page about gauge charts and tolerance standards.
How often are the numbers re-checked?
I re-pull both Search Console reports at fixed checkpoints and keep the window length identical so that window drift does not contaminate the comparison. The data here is checkpoint-level rather than day-by-day, which is the main limitation.