AI Visibility Metrics: Mentions, Citations, Share of Voice and Traffic
Quick Context: I have been measuring AI search visibility for a few months, first badly and then slightly less badly. The first version of this post was the bad version: it treated “AI visibility” as one number, borrowed a screenshot from a tool, and called the numbers traffic. This version separates four metrics that get conflated, states the denominator for each, and says plainly where the data runs out.
If your AI visibility metrics have been one meaningless score until now, that is the whole argument. If you run a small site and want to know whether AI answers mention you — and whether that is worth anything — this is the order I would do it in.
What “AI search visibility” actually means
When someone asks an AI search product a question, the answer may contain your brand name, a link to your page, neither, or both. Those are three different events, and they happen in products that are only loosely related: Google’s AI Overviews and AI Mode run inside Search, while ChatGPT, Perplexity, Gemini and Copilot are separate products with their own retrieval and their own rules. Treating them as one channel hides the thing you are trying to measure.
So the useful definition is narrow. AI search visibility is the frequency with which a brand or page appears in answers produced by AI search products, for a defined set of prompts, on a defined set of platforms, over a defined period. Every one of those four qualifiers matters, because dropping any of them turns a measurement into an impression.
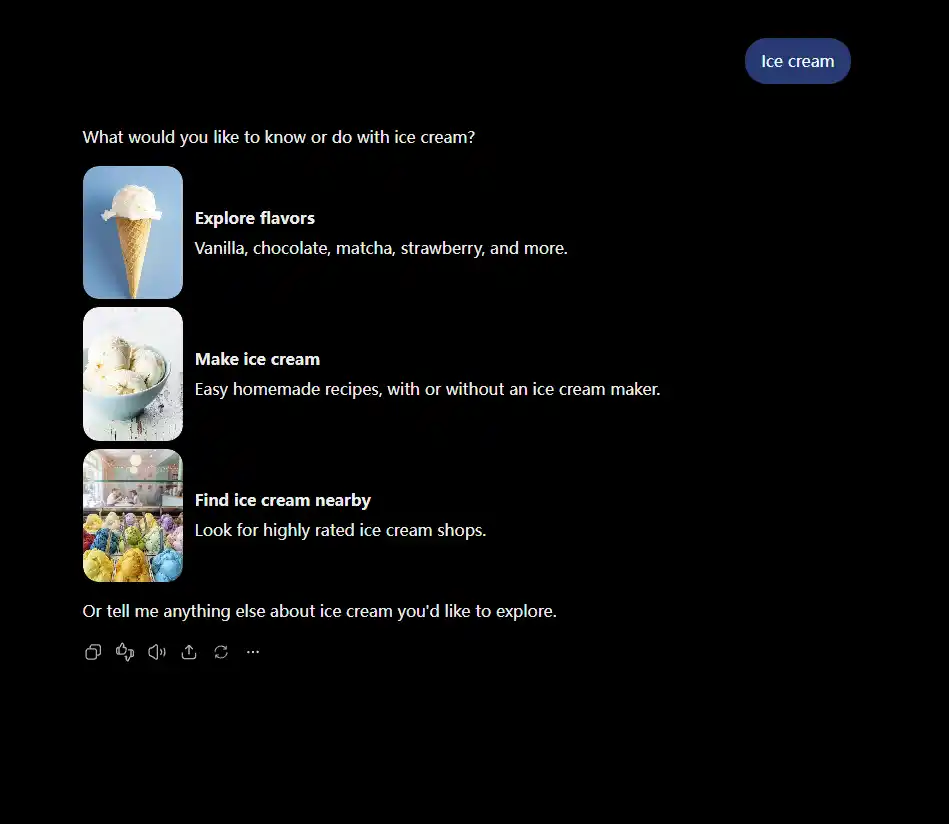
That first answer is the part people forget to measure: a short, generic prompt produced a menu, not a recommendation. No brand was mentioned, so no brand could be visible in it — and any tool measuring that prompt would record an empty answer for everyone.
Now the same topic with a different phrasing:
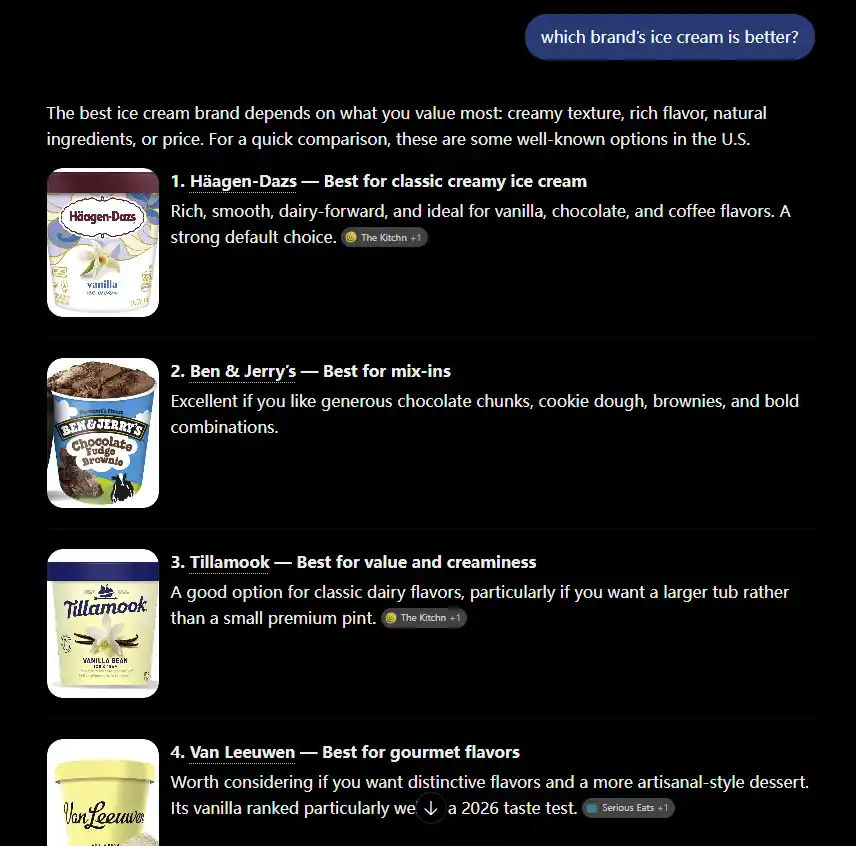
Same product category, a completely different measurement. Here brands are named, ranked and given short justifications, and the little chips beside two of them are citations. A mention and a citation appeared in the same answer, and they are not the same event: the brand name is the mention, the source chip is the citation.
How to monitor AI search visibility: four metrics, four denominators
Most confusion in this niche comes from using one word — visibility — for four numbers that answer different questions. These are the four AI visibility metrics I would put on any dashboard, and the denominator each one needs. Here is the distinction I now use, with the denominator written out, because a rate without a denominator is not a measurement.
| Metric | Question it answers | Denominator to state |
|---|---|---|
| Mention rate | Does the answer name my brand? | Prompts tested (N), platforms, language, country, date |
| Citation rate | Does the answer link to my pages? | The same prompt set, run on the same date |
| Share of voice | How do I compare with the brands I compete with? | Vendor-defined — see below, because tools disagree |
| Referral sessions | Did anyone arrive from an AI product? | All sessions in your analytics, with referral source named |
Mention rate: the number you can actually compute yourself
Write your prompt set down, run each prompt on each platform, and record yes or no. The rate is mentions divided by prompts tested — nothing more. Two rules keep it honest. First, count a prompt once even if your brand appears three times in one answer; that is the counting rule Ahrefs documents for its own mentions metric, and it is the rule that makes your sheet comparable with a tool’s. Second, keep the raw counts visible next to the percentage: “7 of 20” survives scrutiny in a way that “35%” does not.
AI mentions vs citations: a link is a different event from a name
A page can be cited without your brand being named, and your brand can be named without any link. When you log citations, log the URL, not just the domain, because the useful question later is which page earned the link and what it contained. Semrush defines citations as “the number of AI responses that cite your domain as a source”, which is per-response, not per-link — if one answer links to three pages of yours, that is one citation in their count.
Share of voice: read the label before you read the number
This is where most comparisons go wrong, including my first draft of this post. “Share of voice” is not a single measure. Semrush defines its Share of Voice as “the percentage of mentions your brand receives in AI-generated answers compared to competitors in your market”, and its own walkthrough gives the manual form: your AI mentions divided by total AI mentions across all brands in the category. Ahrefs defines its AI Share of Voice as a brand’s “percentage share of impressions compared to other tracked brands” — impressions being modelled from search demand, so the denominator is weighted exposure, not mentions.
Two consequences follow. A manually counted mention rate is not the same thing as a tool’s share of voice, because the prompt universe and the denominator are both different. And a share of voice from one vendor cannot be compared with a share of voice from another; a 20% SOV in a mentions-based metric and a 20% SOV in an impressions-based metric describe different worlds. If you need to compare across tools, compare direction and rank ordering, never the percentage.
AI referral traffic: three sources, three different holes
Google now reports impressions from its generative AI features in Search Console, but as of publication that report does not include click data; it tells you that a link to your page was shown inside AI Overviews, AI Mode or Discover’s AI features, by page, country and date. Google’s own guidance says an impression is counted when a link to your site appears there, which means the figure is about being linked, not about being read. One precondition worth checking: Google’s Search generative AI control lets a site opt out of these features, and an opted-out site will show nothing in that report — so confirm the setting before concluding you are invisible.
Traffic from ChatGPT, Perplexity and similar products usually shows up in web analytics as referrals from those domains — check your own referral list rather than assuming. Clicks inside AI Overviews and AI Mode cannot be separated from ordinary organic Search traffic, because they arrive as Google organic sessions. That asymmetry is the single most common misreading I see: people compare an AI-overview impression count with a ChatGPT referral count as if they were the same unit. They are not even the same kind of measurement.
AI visibility metrics: what each source can and cannot tell you
| Source | What it measures | What it cannot tell you |
|---|---|---|
| Your own prompt sheet | Mentions and citations for the exact prompts, platforms and dates you chose | Anything about prompts you did not test; anything about the wider market |
| Semrush AI Visibility Toolkit | A 0–100 visibility benchmark, mentions, citations, share of voice, estimated audience | Your own prompt set’s exact wording; whether a mention produced a visit |
| Ahrefs Brand Radar | Mentions, citations, modelled impressions, impressions-based AI SOV | Actual human exposure — impressions are modelled from search volumes |
| GSC generative AI report | Impressions inside Google’s generative AI features, by page and country | Clicks (not included as of publication); other platforms |
| Web analytics | Sessions whose referrer is an AI product domain | AI answers that produced no click; Google AI features, which look like organic |
None of these four sources is wrong. They are answers to different questions, and the mistake is picking one and calling it “AI visibility”. A table of AI visibility metrics that does not name its source is a table of numbers, not a measurement.
A measurement workflow for a small site
This is how the four AI visibility metrics become a procedure I would actually repeat. It costs nothing except time, and the first pass takes about two hours.
Step 1 — Fix a prompt set of 12 to 20 questions
Small sets are fine if they are deliberate. Split them into four types so the set is not all one intent: category prompts (“best PVC film for furniture lamination”), comparison prompts (“clear PVC film vs super clear”), job prompts (“how thick should PVC film be for packaging”), and brand-plus-competitor prompts. Write them exactly as a buyer would type them, keep the wording frozen for the duration, and record the platform, language and country for each run. If you change the wording halfway, you have changed the test, not the result.
Four to six prompts per type is enough for a first pass; twelve is the minimum I would trust for a decision.
| Prompt type | Example (from my own niche) | What it tells you |
|---|---|---|
| Category | best PVC film for furniture lamination | Whether you are in the consideration set at all |
| Comparison | clear PVC film vs super clear PVC film | Whether you get named when options are weighed |
| Job to be done | how thick should PVC film be for packaging | Whether a page of yours is cited for a practical task |
| Brand + competitor | your brand vs [competitor] | The baseline for any share-of-voice claim |
Step 2 — Build a baseline sheet you can defend
| Column | Why it is there |
|---|---|
| date, platform, country | No date, no comparison |
| prompt (frozen text) | Lets you re-run identically later |
| mentioned (Y/N), brand position | Presence and prominence are different |
| cited (Y/N), URL cited | Tells you which page earned it |
| competitors named | The only way to compute a share later |
| answer note (one line) | Explains odd results when you revisit them |
Step 3 — Run the tool pass separately from your sheet
If you pay for a tool, record the metric name, the platform scope, the date range and the plan tier alongside the number — a snapshot without those four fields is not reproducible. In Semrush, that means the AI Visibility Toolkit’s Visibility Overview report; in Ahrefs, Brand Radar. Then keep the tool numbers in a separate column from your manual counts, because they use different prompt universes and different denominators. Mixing them into one “visibility” line is how my first draft went wrong.
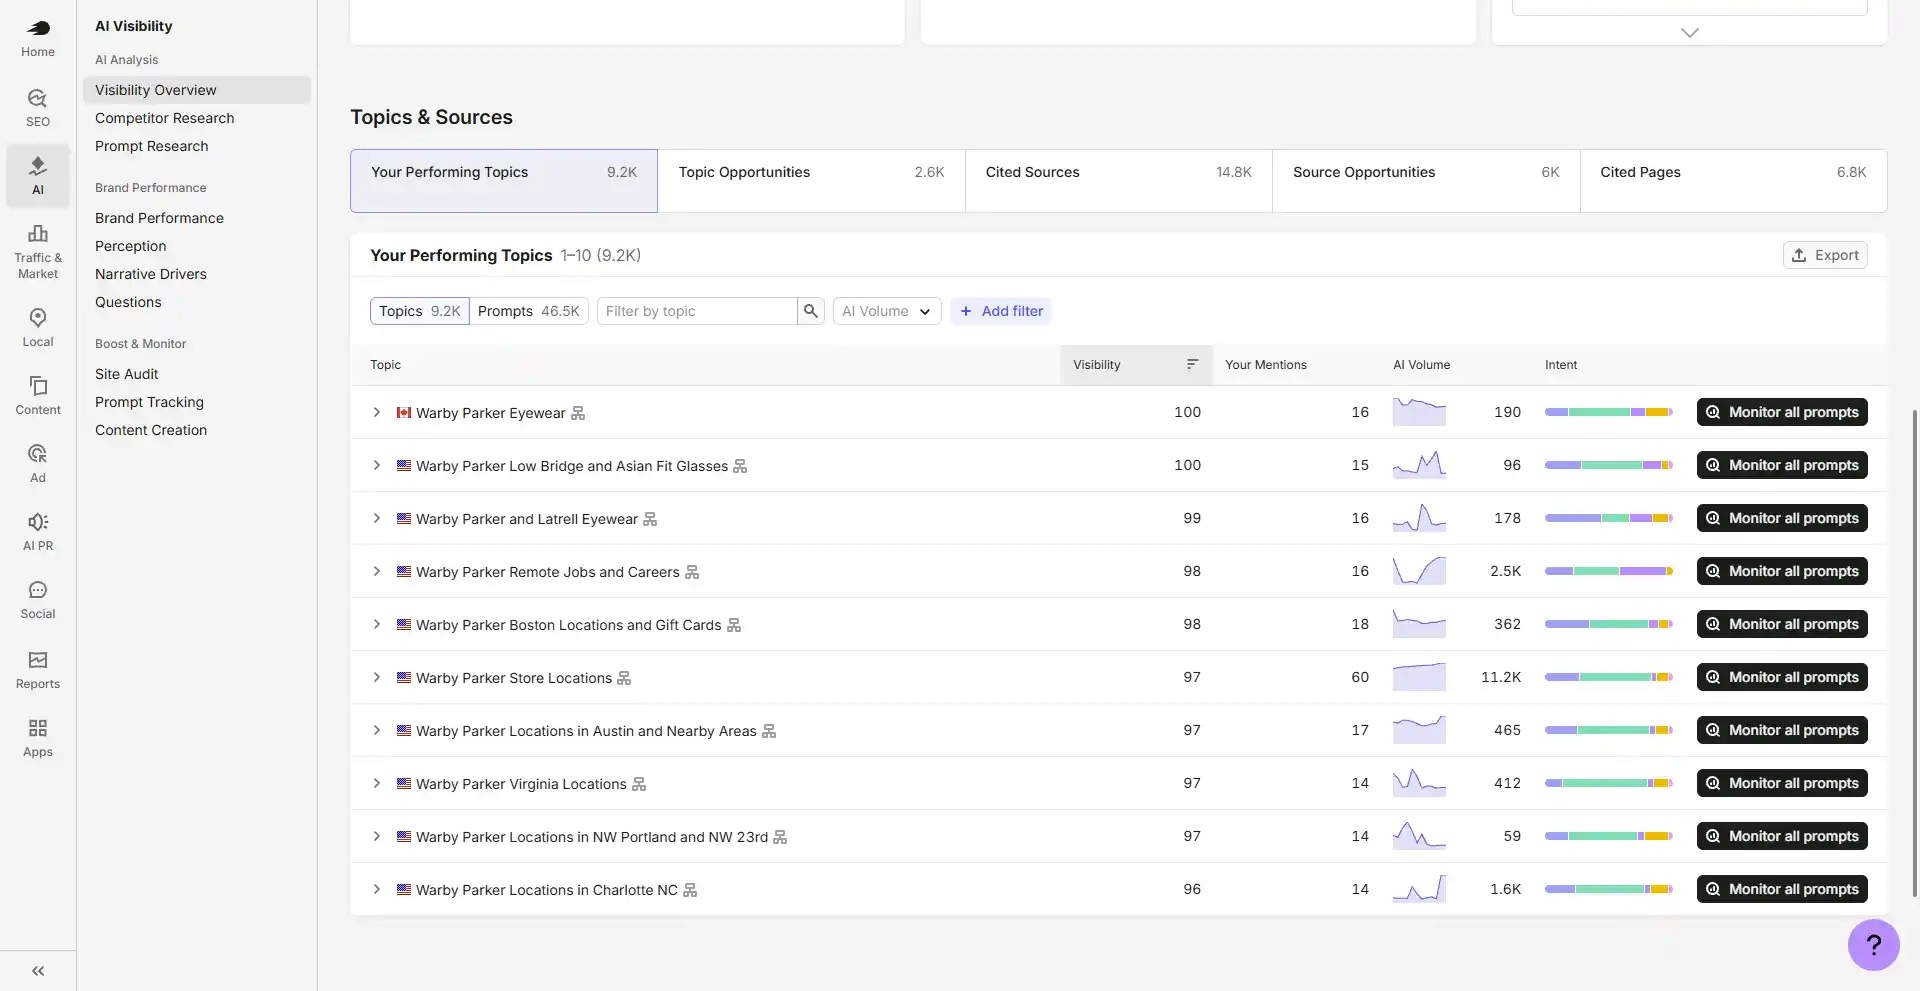
This view is where prompt choice gets exposed. Every topic at the top of that list contains the brand name, and every one scores 96 to 100 on visibility — of course it does, the prompt asks about the brand. If your prompt set is only brand prompts, your visibility number will look excellent and mean almost nothing. That is why step 1 insists on category and job prompts before brand prompts.
Step 4 — Join the traffic data, knowing where the seams are
Pull the generative AI impressions from Search Console for the pages you care about, then pull referrals in your analytics and tag the AI domains you actually see. Compare like with like: impressions to impressions, sessions to sessions. Do not add an impression count to a session count. And do not treat a rise in either one as proof that a particular edit caused it — the cheapest error in this discipline is attributing a monthly average to last week’s work.
Step 5 — Decide with rules, not vibes
Before you look at the results, write down what each outcome would mean. Two examples I use: if mention rate is high and citation rate is low, the answer knows the brand but not the page, so the next test is adding quotable, verifiable specifics to the pages that should be cited. If both are low while competitors are present, the prompt set is probably fine and the content is absent, so the next test is coverage rather than optimisation. State a falsifier too — for example, “if citation rate has not moved after 60 days of adding definitions and tables to five pages, my evidence hypothesis is wrong”.
How to read an AI share of voice screenshot without over-reading it
Semrush’s own demo brand is a good teaching case, because it shows how easy the misreading is. In that demo (snapshot taken 27 October 2026), the Distribution by LLM panel splits into ChatGPT 15.1%, AI Overview 52.5%, AI Mode 19.2% and Gemini 13.2%, with 3.1k, 10.6k, 3.9k and 2.7k written beside them.
The four figures add up to 20.3k against a headline Mentions figure of 20.2K — rounding, not a discrepancy — and each percentage multiplied by that total reproduces its own figure. That arithmetic tells you what the unit is: these are mentions per platform, and the percentages are a share of mentions. They are not visits, and I have seen this panel described as traffic more than once — including in my first draft of this post.
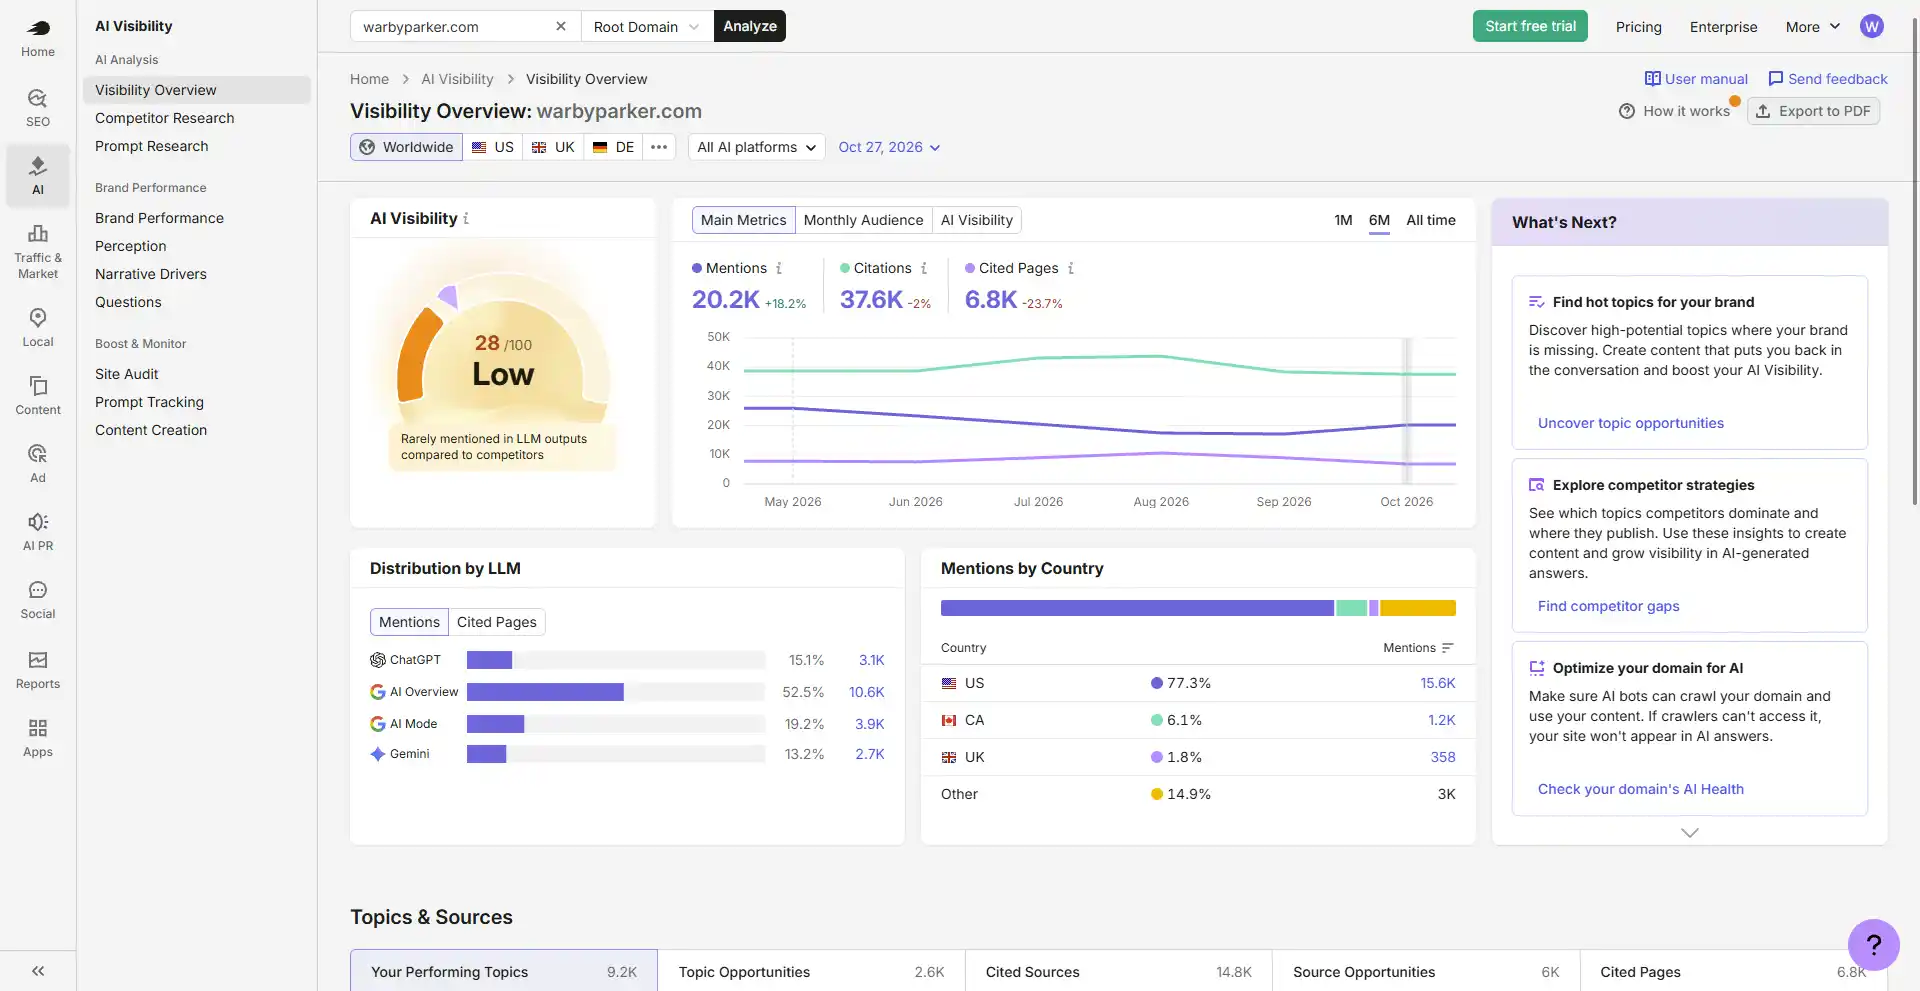
That same screenshot holds a second lesson. In the Main Metrics row, Citations (37.6K) are larger than Mentions (20.2K) over the same six months. That is not a bug: a response can cite one of your pages without naming your brand, so the two counts are not nested. Anyone who treats citations as a subset of mentions will misread the report on the first day.
It also shows why a single score is dangerous. This account scores 28 out of 100 and is labelled “Low” while still collecting 20.2K mentions — because the score is relative to competitors, not an absolute measure of exposure. A low number here does not mean invisible; it means out-talked.
The column that looks most like traffic is the one Semrush calls Monthly Audience, and it is an estimate of the query demand behind the prompts where your brand appears — the combined search volume, not sessions. Useful for weighting how much a topic matters; useless for forecasting visits. The same caution applies in reverse to impressions-based share of voice, where the denominator is modelled exposure rather than mentions.
Three habits keep the screenshot honest. Note the date range and the platform list, because a report covering four platforms is not comparable with one covering two. Note whether the metric is mentions-based or impressions-based before comparing anything. And treat small moves as noise until the reading survives two consecutive windows; AI answers vary by session and by sampling, and a one-week swing in a small prompt set is not a signal.
Does visibility turn into traffic?
Not reliably, and not on a schedule. Three reasons come up again and again in my own data. A mention without a citation gives the reader nothing to click. A citation on a research prompt may still end the session inside the answer, because the answer already resolved the question. And an AI answer can recommend you for a query your page does not rank for, so the referral lands on a page that was never built for that intent.
The honest position is the one I hold after a few months of this: AI visibility is a presence metric before it is a traffic metric. Measure it to know whether you are in the room, then measure the page the referral lands on before blaming the platform. If you want the timing side of that argument, my note on how long SEO takes to show results applies here too — the window is longer than the dashboard cadence suggests. For what a handful of AI Overview impressions looked like on one page of mine, there is an earlier note with the actual numbers.
What I stopped tracking, and what I would check first
I dropped three habits. Weekly SOV swings, because they are sampling noise in a small set. Cross-tool SOV deltas, because the denominators are not the same animal. And single-prompt wins, because one good answer is an anecdote. What I check first instead is boring, and it is the part of measuring AI visibility that actually changes decisions: whether the cited URL is the page I would have chosen, and whether the answer’s facts about my product are right.
That last check leads somewhere practical. If the answer is citing you but describing you badly, the problem is on your page, not in the model — and on my own site the version of that problem was at the crawl layer, which I wrote up in what 4,265 server log lines showed about AI crawlers. If your pages are not being fetched, no amount of prompt tracking will move anything — the technical checks for small sites are where I would start.
Limits of this method
Four limits belong on the record, and they apply to any attempt to measure AI search visibility at this scale. The sample is small: twelve to twenty prompts is enough to guide decisions and not enough to estimate a market. The platforms are sampled, not observed: answers differ by session, by personalisation and by what the model retrieved that day. The tool metrics are modelled, and modelling choices are the vendor’s, not yours. And nothing here establishes causation — a rise in citations after an edit is a correlation inside one window on one site.
What you get for accepting those limits is a set of AI visibility metrics you can explain to someone else: four metrics, four denominators, four sources with known holes, and a decision rule written down before the data arrives. That is more useful than a score, and it is the only version I can defend.